NexSens WQData LIVE Web Datacenter
kr0,00 eks. mva – kr65.450,00 eks. mva
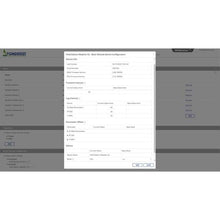
WQData LIVE is a web-based project management service that allows users 24/7 instant access to data collected from remote telemetry systems. Users with NexSens G2 and X2 platforms have the ability to configure and update systems remotely via Wi-Fi, Ethernet, cellular or satellite telemetry. All projects are password-protected with multi-level access. Administrators have full access for remote communication and project modification, while collaborators are limited to viewing and exporting data.
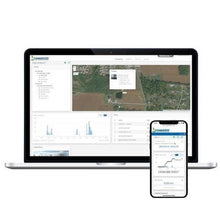
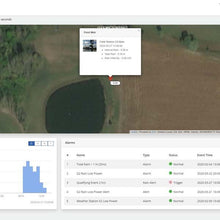
The online database offers the ability to view live readings, configure alerts to notify project personnel when data values exceed threshold limits, export data and more. The project dashboard includes a ESRI Leaflet map view showing all project sites on a map with zoom, scroll and drag capability. The bottom of the dashboard includes a project overview, data disclaimer and project photo. For projects with multiple locations, each site within a project shows the data loggers connected along with a site photo in a convenient viewing pane.
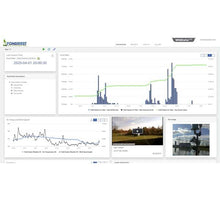
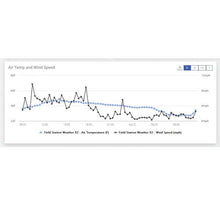
Clicking on any site within a project displays the most recent data values alongside a graph depicting a day, week, month or year of data. Within each parameter, users can register to receive alerts via email based on a high or low threshold. A rich set of meta data and diagnostic data specific to each site is displayed at the bottom for troubleshooting sensor or data logger issues. With this rich set of tools, WQData LIVE simplifies the task of managing an environmental monitoring project.
kr0,00 eks. mva
WQData LIVE is a web-based project management service that allows users 24/7 instant access to data collected from remote telemetry systems. Users with NexSens G2 and X2 platforms have the ability to configure and update systems remotely via Wi-Fi, Ethernet, cellular or satellite telemetry. All projects are password-protected with multi-level access. Administrators have full access for remote communication and project modification, while collaborators are limited to viewing and exporting data.
The online database offers the ability to view live readings, configure alerts to notify project personnel when data values exceed threshold limits, export data and more. The project dashboard includes a ESRI Leaflet map view showing all project sites on a map with zoom, scroll and drag capability. The bottom of the dashboard includes a project overview, data disclaimer and project photo. For projects with multiple locations, each site within a project shows the data loggers connected along with a site photo in a convenient viewing pane.
Clicking on any site within a project displays the most recent data values alongside a graph depicting a day, week, month or year of data. Within each parameter, users can register to receive alerts via email based on a high or low threshold. A rich set of meta data and diagnostic data specific to each site is displayed at the bottom for troubleshooting sensor or data logger issues. With this rich set of tools, WQData LIVE simplifies the task of managing an environmental monitoring project.


